One of today’s most certain variables in a school district’s strategic planning is uncertainty. According to the National Center for Education Statistics, the data arm of the U.S. Department of Education, on average, student enrollment is expected to increase 3 percent between 2015 and 2027. But statistics collected by the Western Interstate Commission for Higher Education (WICHE), a nonprofit agency that predicts high school enrollment to help colleges plan for future students, suggest a steep decline in student enrollment—to the tune of 8.5 percent. Either extreme relies on speculation regarding birthrates, immigration policy, and individual families’ choices in increasingly competitive systems.
We report on an enrollment strategy tested by a large urban district in the Midwest. This diverse district has large shares of students from low-income families and a significant immigrant and refugee population. It has experienced steady declines in enrollment. Declining enrollments squeeze stagnant budgets and force difficult administrative decisions. To fill classrooms and save on personnel costs, the district began what we refer to here as a split-classroom enrollment strategy. We describe the strategy and underlying rationale and offer evidence of the strategy’s initial effects.
Class-size ranges vs. caps
In 2013, pressed by declining enrollment and tight budgets, district leaders opted to pilot a split classroom strategy. They decided that rather than a hypothetical school having three second-grade classrooms and three third grade classrooms with 22 students each, the school should offer two second-grade classrooms with 27 students each (second and third grade ranges are 22-27), two third grade classrooms with 27 students each, and one combined second and third grade classroom with 24 students. This “split” classroom would allow the building to shed the cost of one full-time teacher and ensure individual classrooms met enrollment caps.
In 2018, with the district’s support, we began to explore the influence of split classrooms on school and district enrollment. Armed with data on the number of total classrooms, the number of split classrooms, class-size averages by grade level, and grade and school enrollments, we created student cohorts (groups of students based on the year that class would have started kindergarten) and indicators to mark the length of time before and after the introduction of a split classroom for that cohort. We have data ranging from five years before a split (if a split occurred in 2018) to two years following a split (if that split occurred in 2016), which allows for an examination of the relationship between classroom splits, class size averages, and grade and school enrolments both leading up to a split and after a split occurs.
The distribution of cohort-year observations was:
| Years to split | -5 | -4 | -3 | -2 | -1 | 1 | 2 |
| n | 5 | 22 | 36 | 44 | 47 | 19 | 2 |
For each cohort we charted the following school-year-grade observations:
| Cohort | 2007 | 2008 | 2009 | 2010 | 2011 | 2012 | 2013 | 2014 | 2015 | 2016 | 2017 | 2018 |
| n | 33 | 33 | 74 | 114 | 158 | 201 | 246 | 215 | 174 | 132 | 88 | 46 |
Split classrooms, average class size, and enrollment
To assess the influence of the split-classroom strategy on class size and enrollment, we ran a series of regressions controlling for class size before and after a split classroom was introduced. Then we compared classrooms that ever experienced a split to those that maintained single-grade classrooms throughout the period of study.
First, we examined only school-cohorts in which there was ever a split classroom. In a model containing a variable that controls for the school in which changes occur (school fixed effects), among the schools and cohorts with a split classroom, the average class size is lower in the three to four years preceding the addition of a split classroom and does not rebound or decline further after a split (Model 1). An alternative model, in which we add controls for grade and year, suggests that average class sizes are highest in the four to five years prior to a split, then decline in the years leading up to a split classroom and continue to decline in the years following the addition of a split classroom (Model 2).
Though model results differ slightly, both tell the same story: lowered or declining class size in cohorts will eventually experience a split. In part because we have more observations of schools before the introduction of a split classroom than after, it is difficult to isolate whether the addition of the split classroom contributes further to a decline or simply does little to counteract an existing trend.
Therefore, as an additional robustness check on results, we then ran the same regressions, adding in school-cohorts that never experienced a split classroom in the 2013-2018 span of our dataset. On average, split classrooms have more students than non-split classrooms and classrooms one or two years prior to a split have a smaller class size than classrooms in the year that they split (as we might expect given the district’s intent with this combined grade strategy). The same trends we saw above are again apparent throughout a series of models, including split and non-split classrooms, year fixed effects, and controls for year and grade (Models 3, 4, 5, and 6).
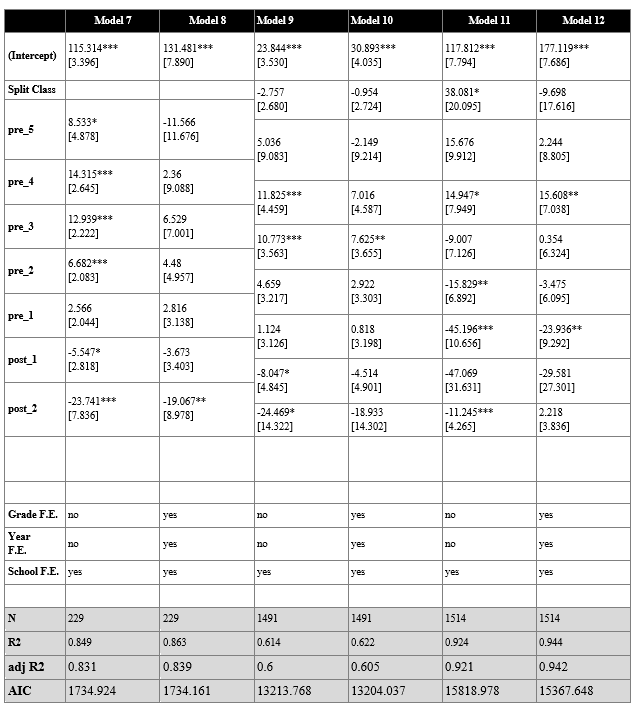
Class size effects are intuitive as split classrooms combine under-enrolled classes to ensure full classrooms. Next, we run the same regressions as above, changing the dependent variable to enrollment (the total number of students in any school-year-grade) to gauge the influence of the split on overall grade level enrollment over time. As above, first we examine only school-cohorts that experience a split classroom between 2013 and 2018. We explore models that include school fixed effects to control for differences in enrollment between smaller and larger schools as well as a model in which we add controls for grade and grade year (Models 7 and 8). In both instances, as with an examination of a split’s influence on average class size, we see enrollment declines leading up to the introduction of a split classroom and significantly lower enrollment two years after a split.
Next, we again examine enrollment as an outcome but add schools and years, regardless of whether they had a split classroom (first utilizing a model with school fixed effects then adding in controls for year and grade level). The same pattern, declining enrollment which continues to decline post-split, is once again apparent (Models 9 and 10).
Up to this point, we have only examined the effects of a split classroom on the enrollment of the grade level in which that split occurs. However, it is possible that the presence of a split classroom in a school at any grade level may affect enrollment in other grades as well. For example, a kindergarten family that sees a second/third-grade split classroom in their school may choose to attend a different school with all single-grade classrooms. To test this possibility, we add a “split_thisyr” variable at the school-year level. For each row of the data (which represents a grade level in a school and year), if there was a split classroom in that school at all in that year, an indicator takes on a positive value.
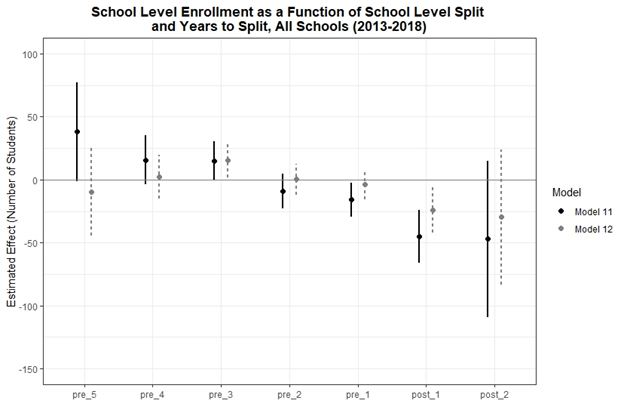
In the two final models, we explore the potential influence of split classrooms on enrollment schoolwide. In our first model (Model 11) in which we employ only school fixed effects, schools that have a split classroom have significantly lower enrollment school wide. Enrollment in these schools is higher in the three to five years prior to a split but lower in the year immediately prior to the split and the two years following the split.
Adding in additional grade and year fixed effects reduces the significance and magnitude of some of the coefficients. In this model, there is no effect on school-level enrollment by having a split classroom in the school at all (Model 12). However, we still see a pattern of higher enrollment in the years leading up to the introduction of a split classroom, and lower enrollment in the two years after the split. The figure below depicts grade and school level enrollment over time for schools that experience a split classroom.
Conclusions
In all our analyses, it appears that the two to three years (and sometimes more) leading up to the introduction of a split classroom are where we can observe statistically significant differences in class size and enrollment. In several cases enrollment is significantly lower in the years immediately following a split.
We have only two years of data for schools that are post-introduction of a split classroom, and there are only a few schools that experienced a split in the initial year in which the strategy was employed. Therefore, we have few post-split observations. The fact that we already see significant effects on those cohorts that are two years post-split, even with limited observations, suggests that we might see even more significant effects if we had more data or continued to track these schools in the years post-split.
Though it is not clear whether adding split classrooms as a response to declining enrollment does nothing or makes the problem worse, it does not improve outcomes. The best-case scenario is that adding split classrooms does nothing to address declining enrollment, and the worst-case scenario is that the split classroom strategy exacerbates enrollment challenges.
Sophia Hannauer is a former research assistant at Macalester College, St. Paul, Minnesota. Lesley Lavery is an associate professor of political science at Macalester College. Kristine West is an associate professor of economics at St. Catherine University, St. Paul, Minnesota.
Table 1: Average Class Size as a Function of Split Classroom and Years to Split
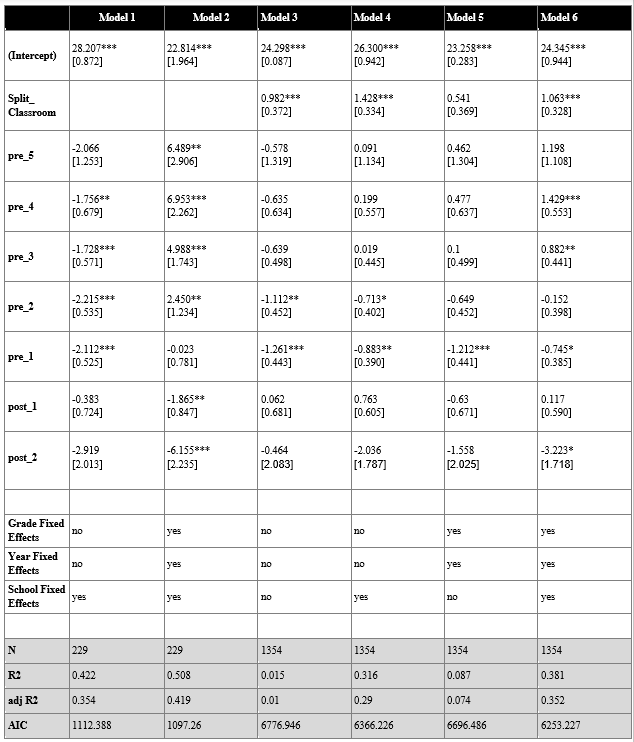
Table 2: Grade Level Enrollment as a Function of Split Classroom and Years to Split

Share this content